

Institutional-grade analytics, on your desktop
Advanced analyses that usually live behind a fund manager’s terminal — six of them gathered in the Lab, plus goal probability inside Goals — running entirely on your own device, against your own portfolio, with every method explained in plain English.
Live Monte Carlo
$50,000 today · $250,000 goal · 10 years · 500 simulated paths
0%
probability of success
Live, in-browser preview · drag the slider to change the odds
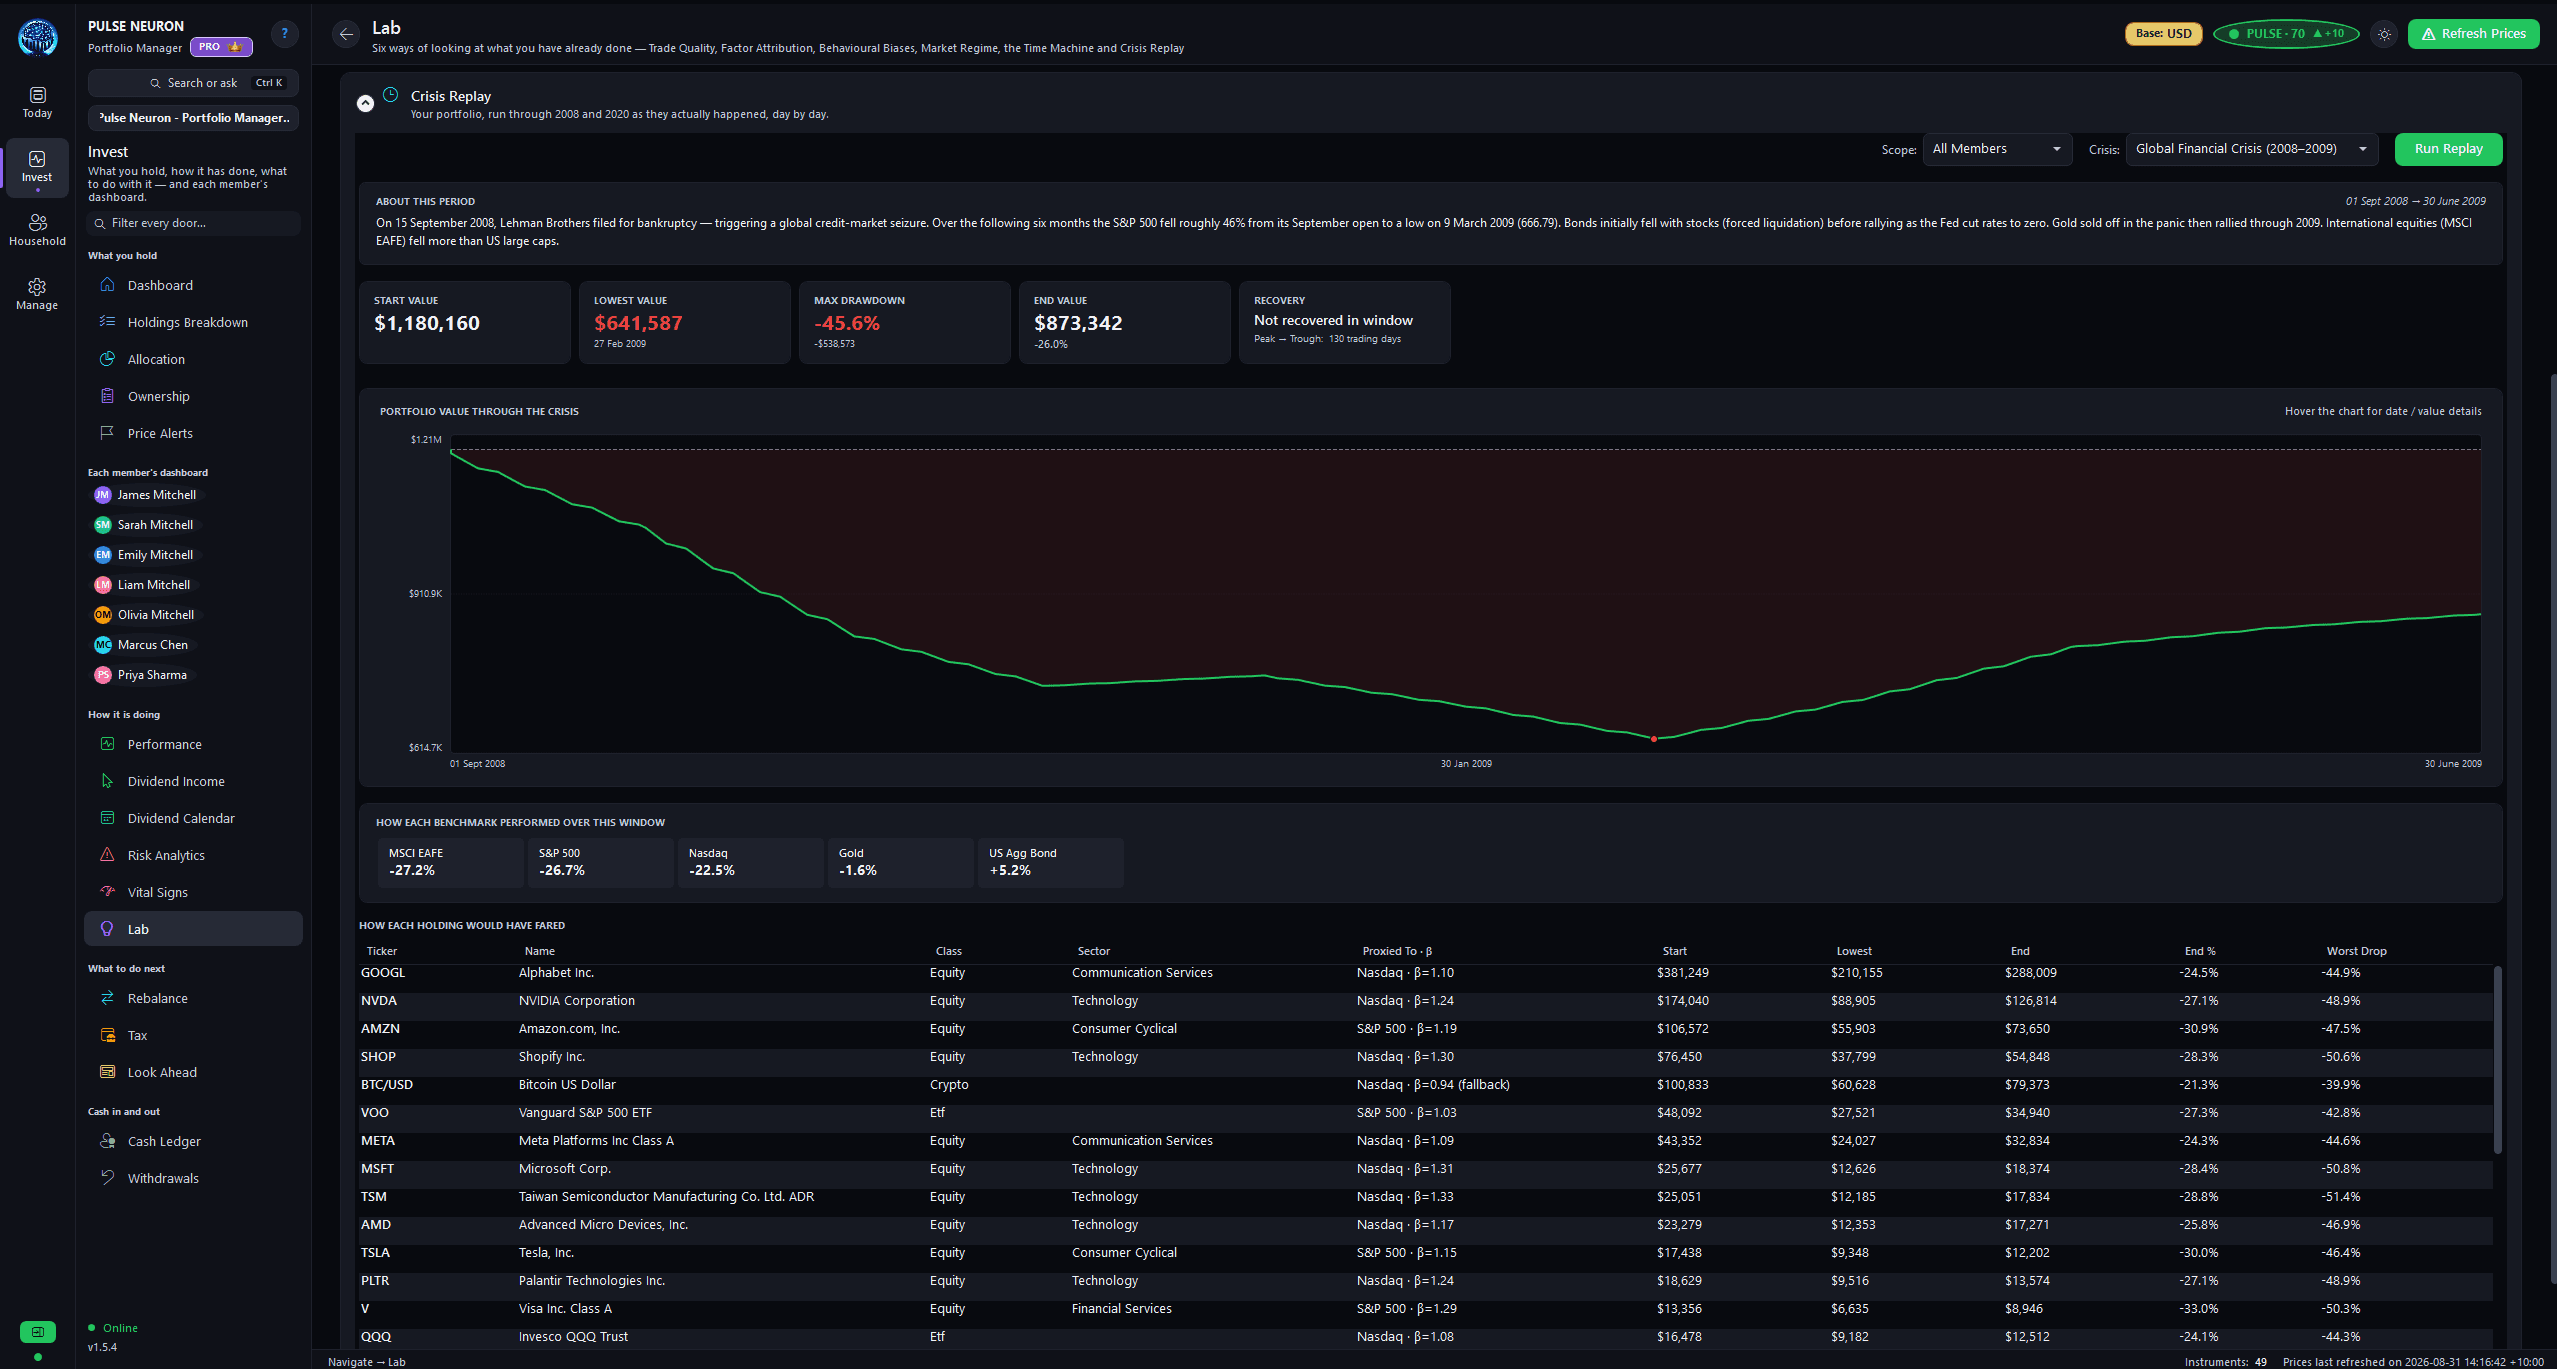
Survive the next crash — on paper first
Replay your current portfolio day-by-day through the dot-com crash, the GFC, COVID, and the 2022 drawdown. See the depth, duration, and recovery you'd actually have lived through.
- Real historical paths through four major crises
- Peak-to-trough drawdown and recovery time
- Per-sleeve contribution to the fall
- A plain-English “what this means for you” read-out
Drawdown replay
Oct 2007 – Mar 2013
0%
from your peak
Peak-to-trough
-55%
Time to recover
~53 months
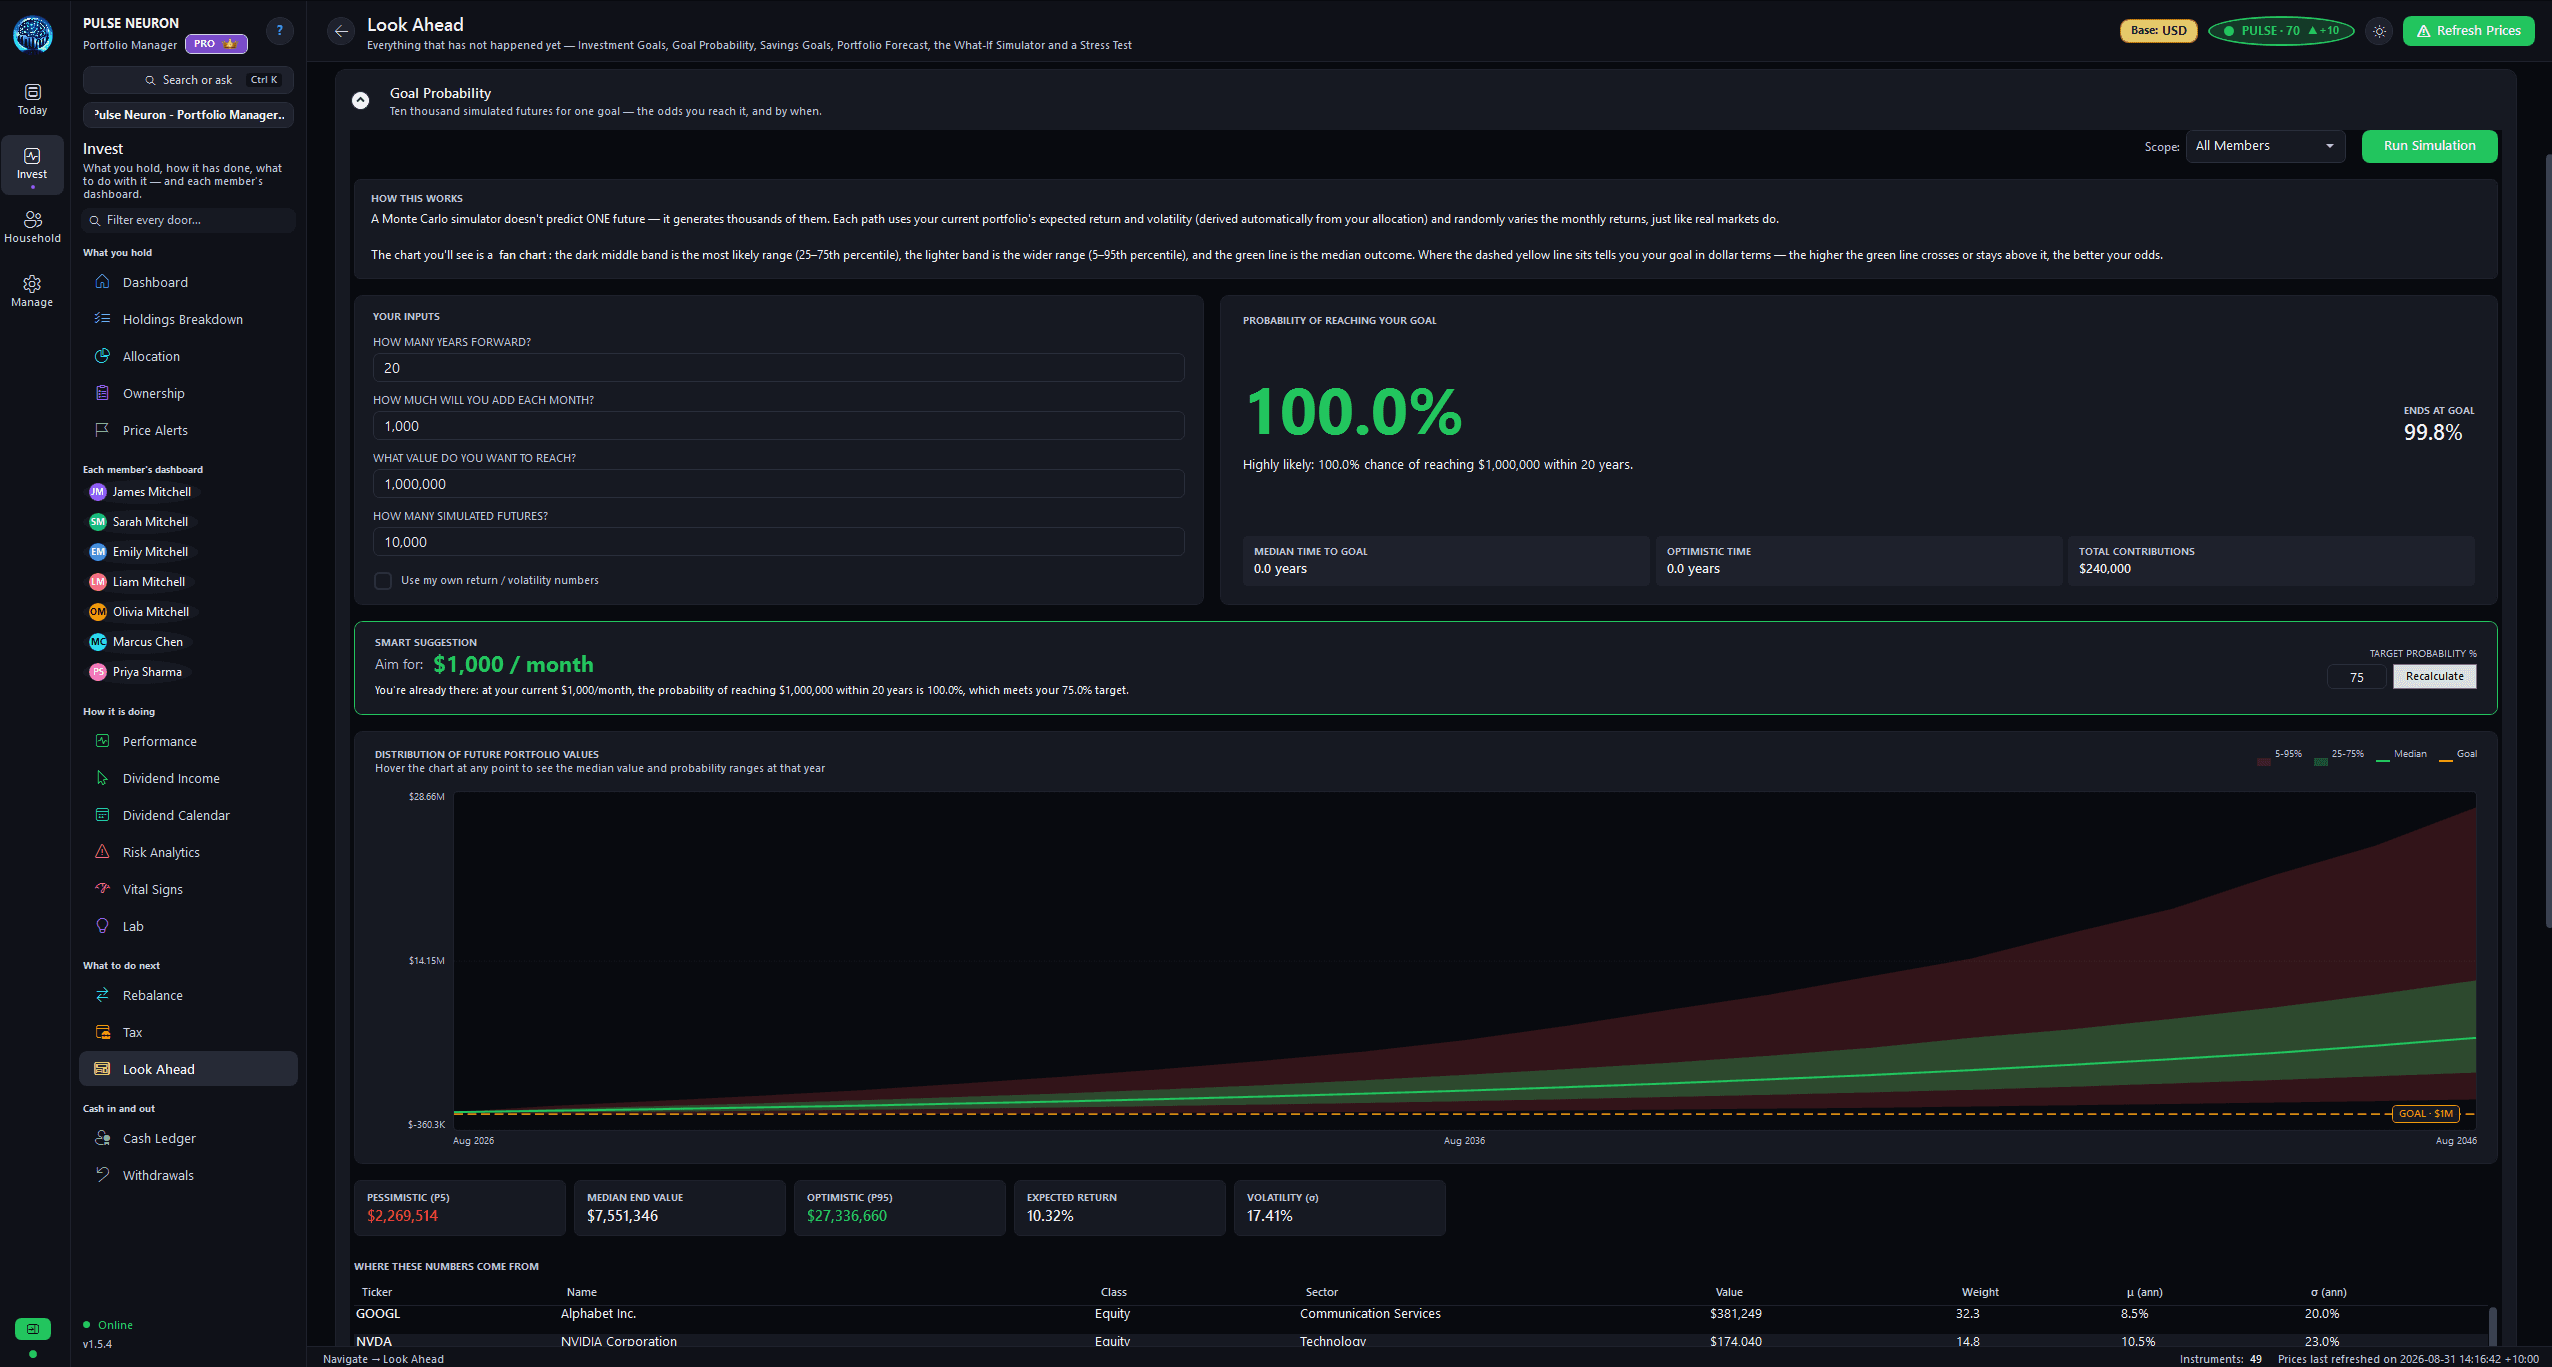
The real odds of hitting your goal
A 10,000-path Monte Carlo simulation projects thousands of possible futures and tells you the probability of reaching your target — plus the exact monthly contribution that would tip the odds in your favour.
- Thousands of simulated market futures
- A clear probability of success
- A smart contribution suggestion
- Adjustable horizon, contribution, and target
Live Monte Carlo
$50,000 today · $250,000 goal · 10 years · 500 simulated paths
0%
probability of success
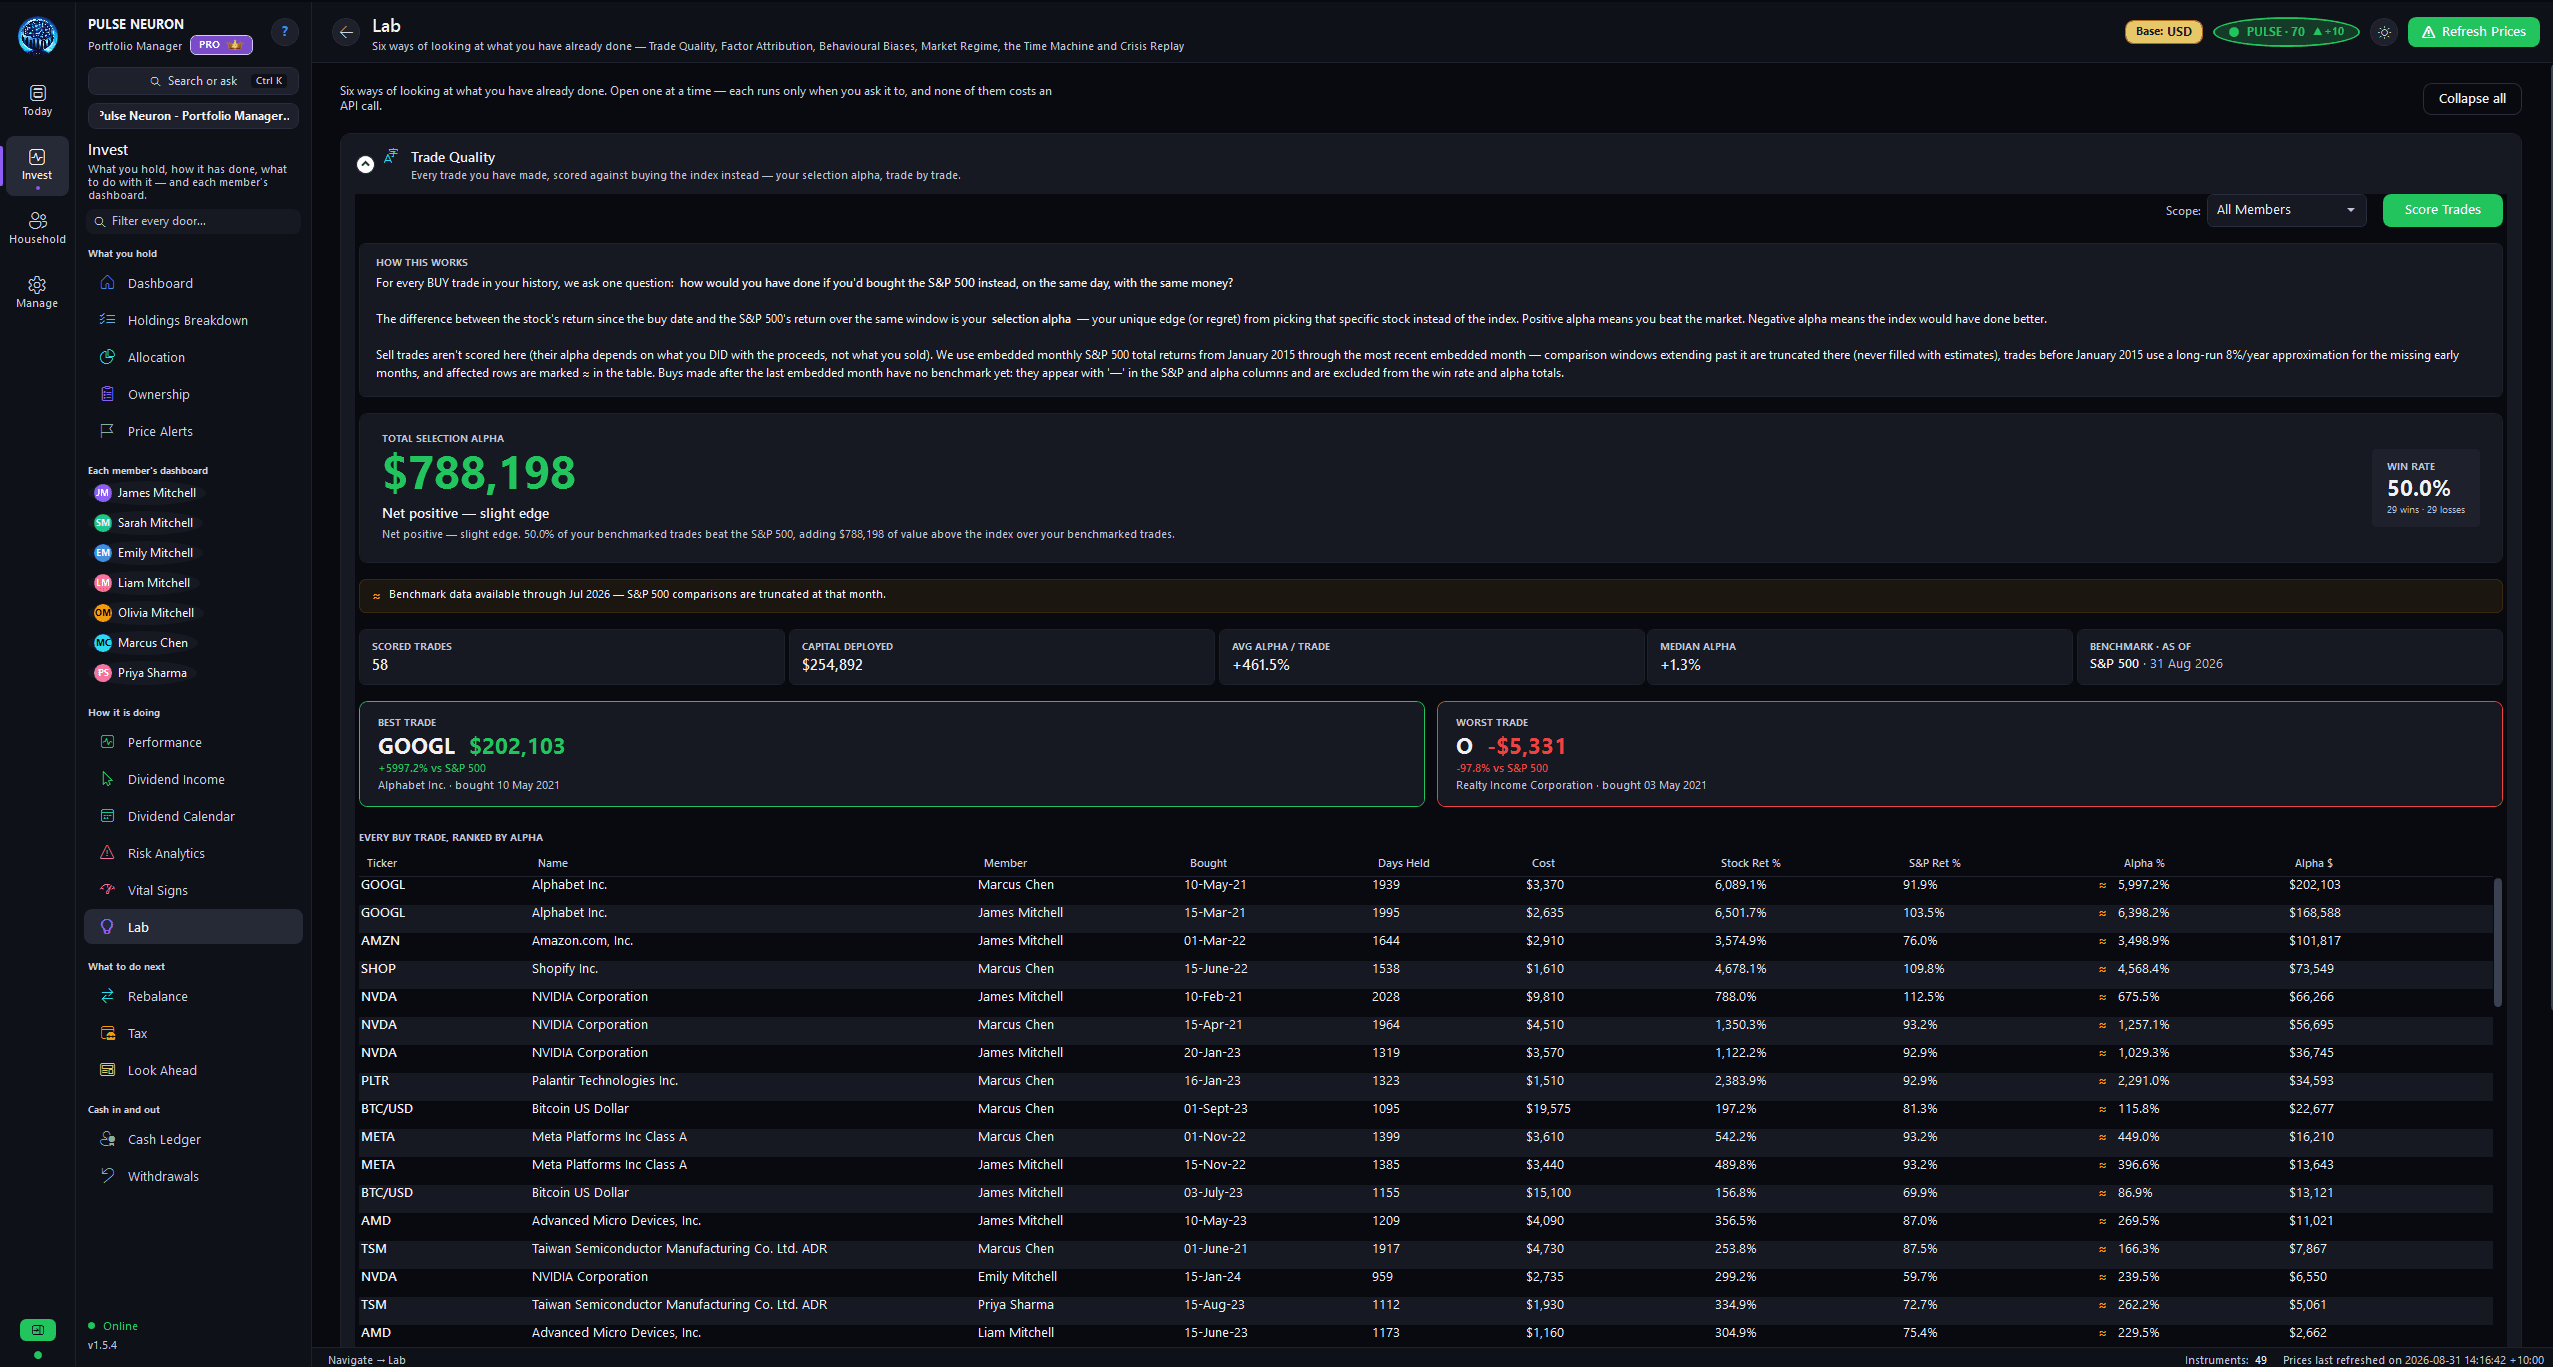
Are you actually a good stock picker?
Every trade you've made, scored against an S&P 500 counterfactual — your personal selection alpha. Find out whether your picks genuinely beat simply buying the index.
- Per-trade alpha versus the benchmark
- Win/loss attribution across your history
- Cumulative selection skill over time
- Honest, data-driven feedback — not flattery
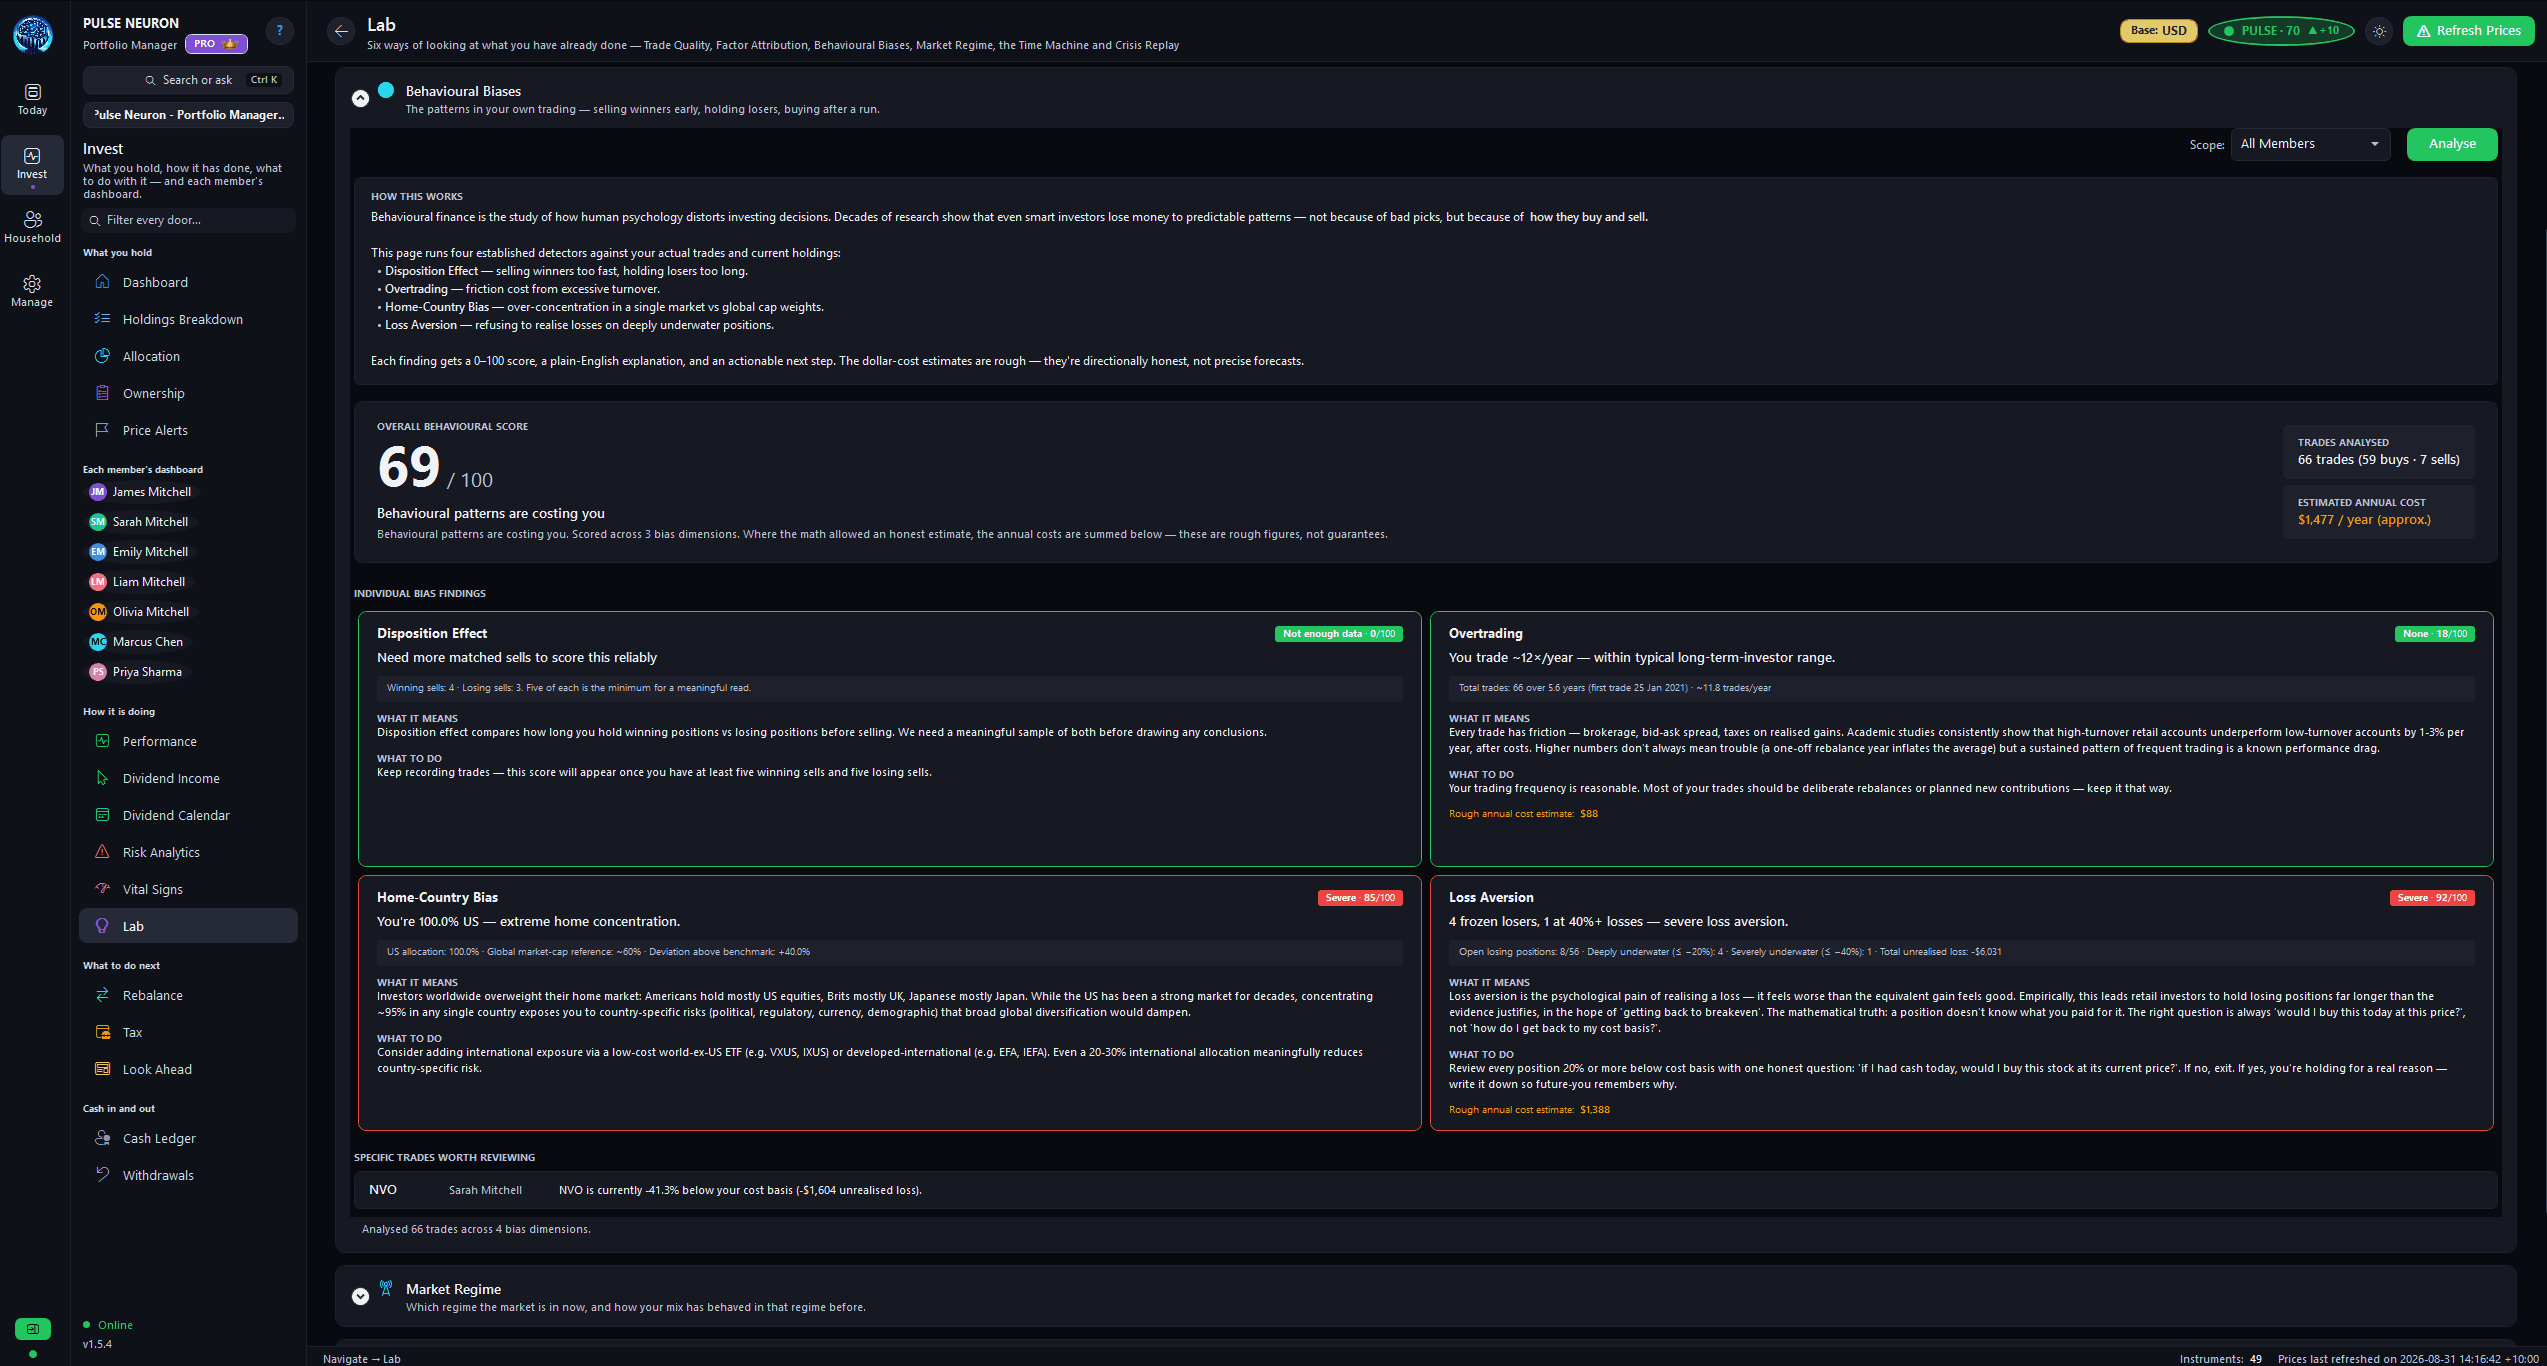
Spot the habits quietly costing you money
Surfaces the psychological patterns in your trading — the disposition effect, overtrading, home bias, and loss aversion — with concrete guidance on what to do about each.
- Four core biases detected from your own trades
- Evidence drawn from your real history
- Severity scoring for each pattern
- Actionable guidance, not jargon
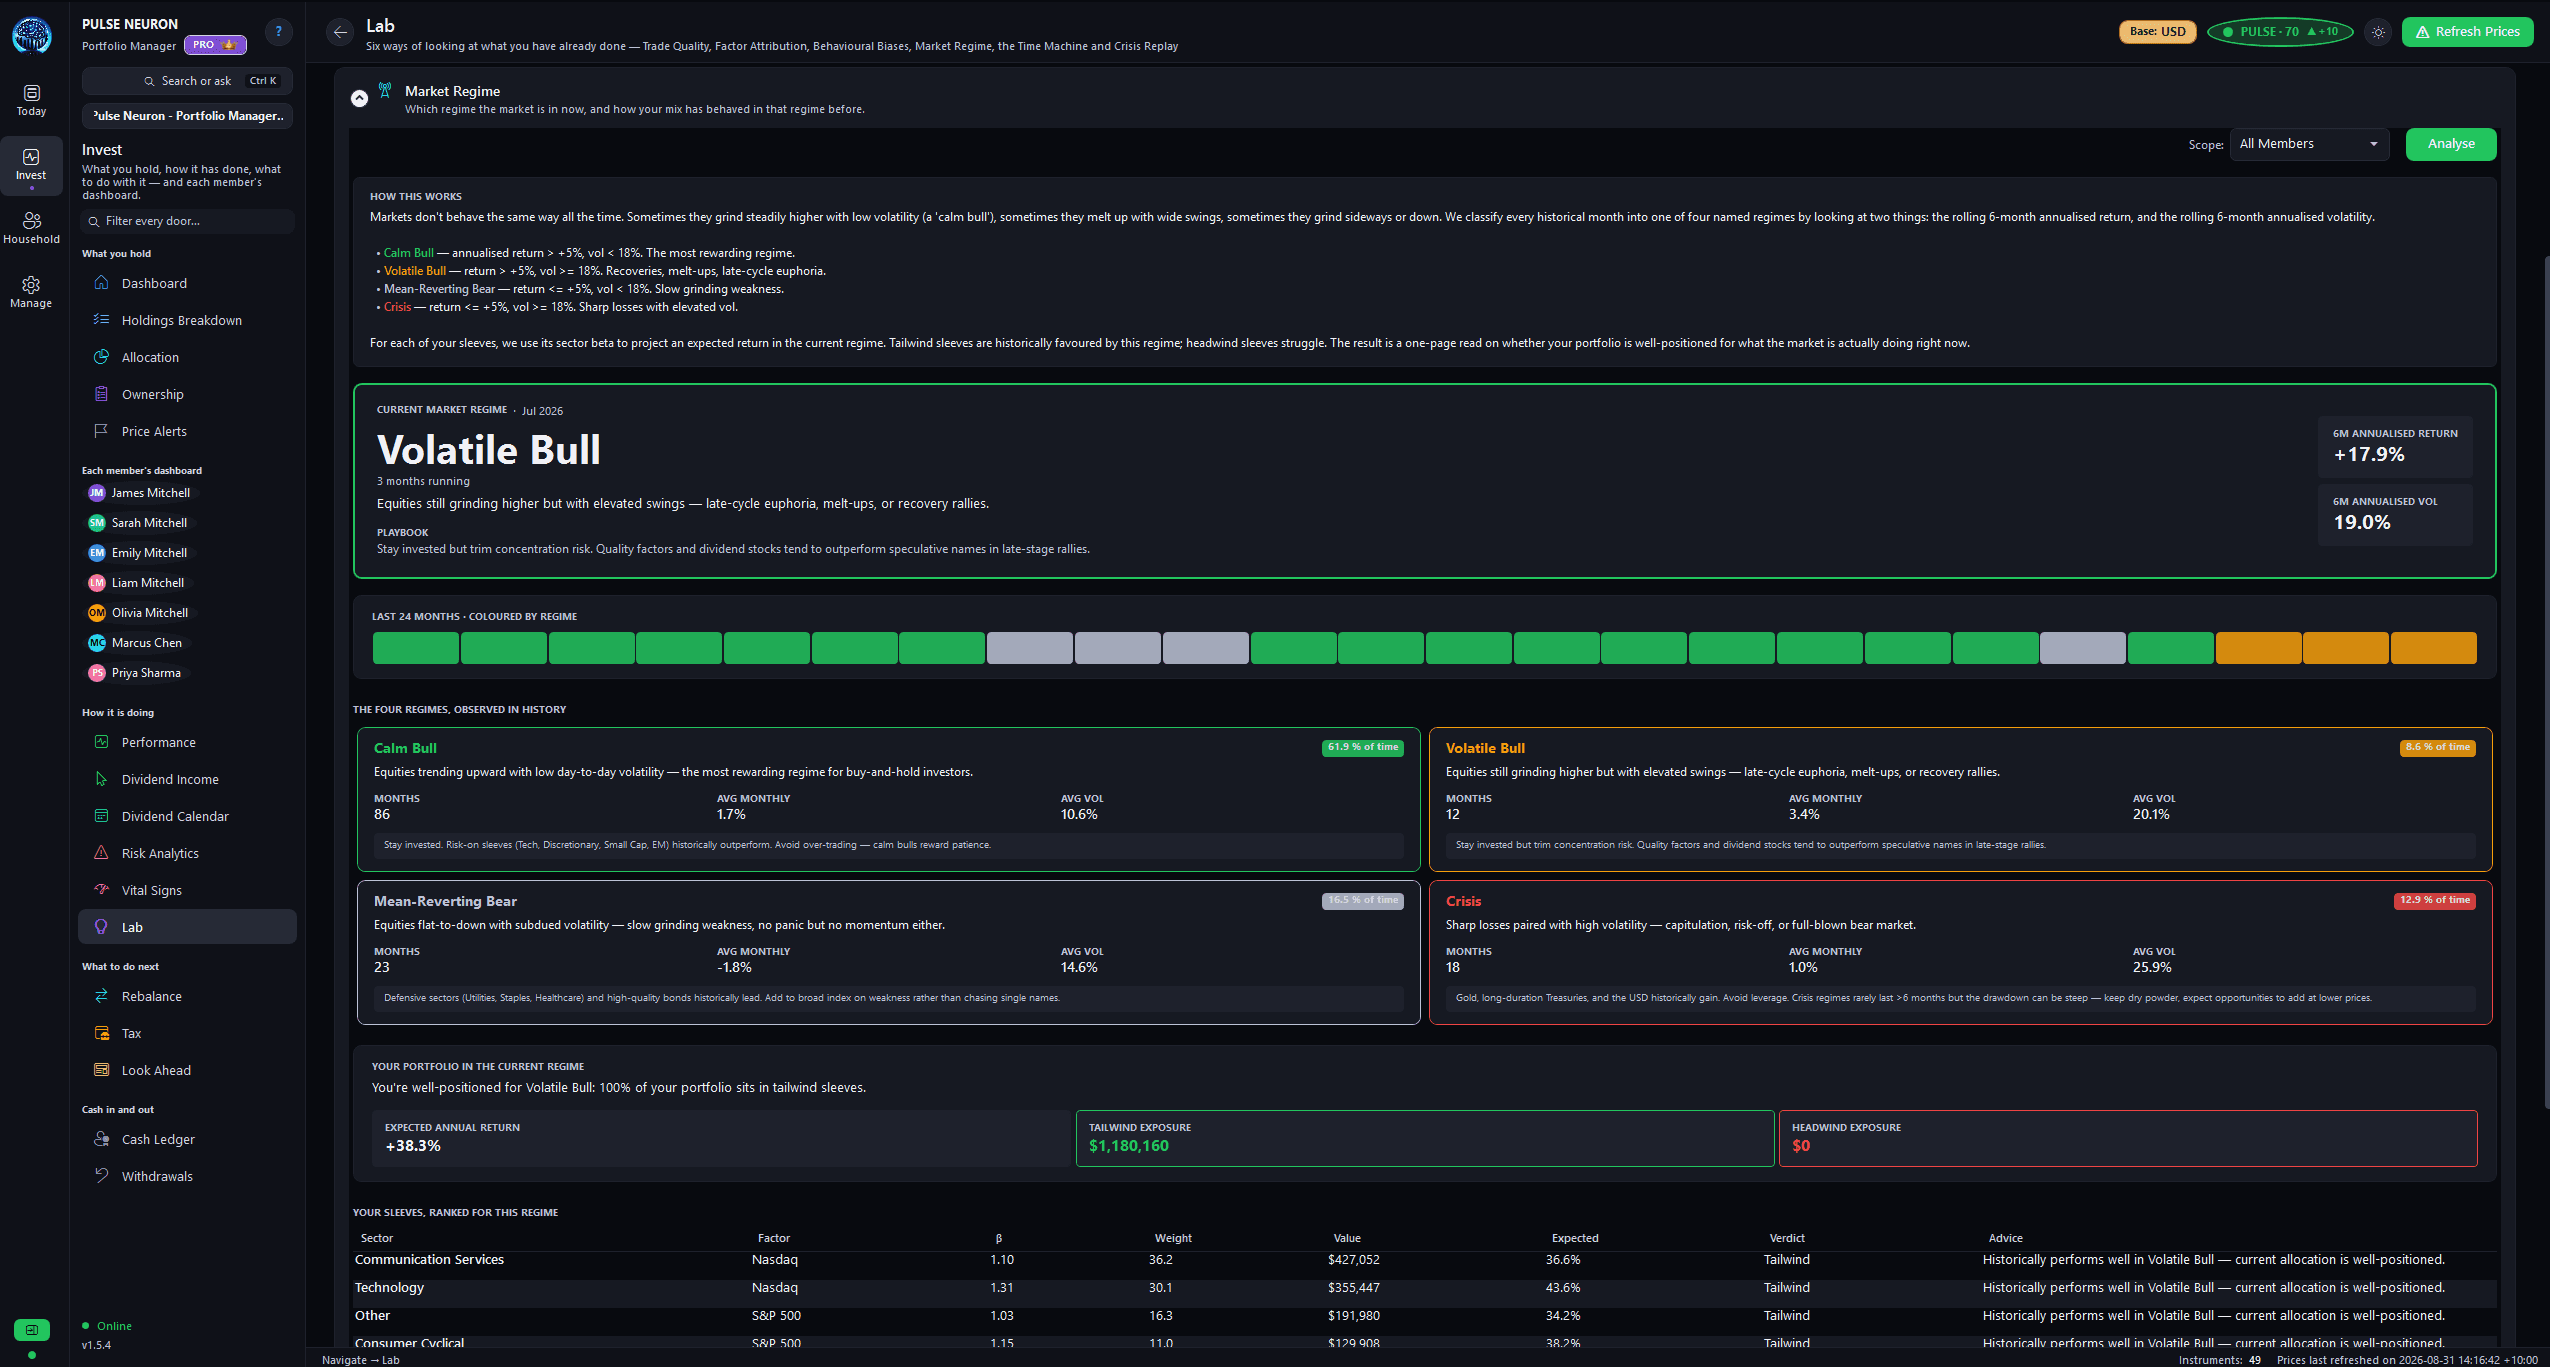
Know what kind of market you're in
Classifies the current environment — Calm Bull, Volatile Bull, Mean-Reverting Bear, or Crisis — and shows how each of your sleeves is positioned for it.
- Clear regime classification
- Volatility and trend signals
- Per-sleeve positioning for the regime
- A historical regime timeline
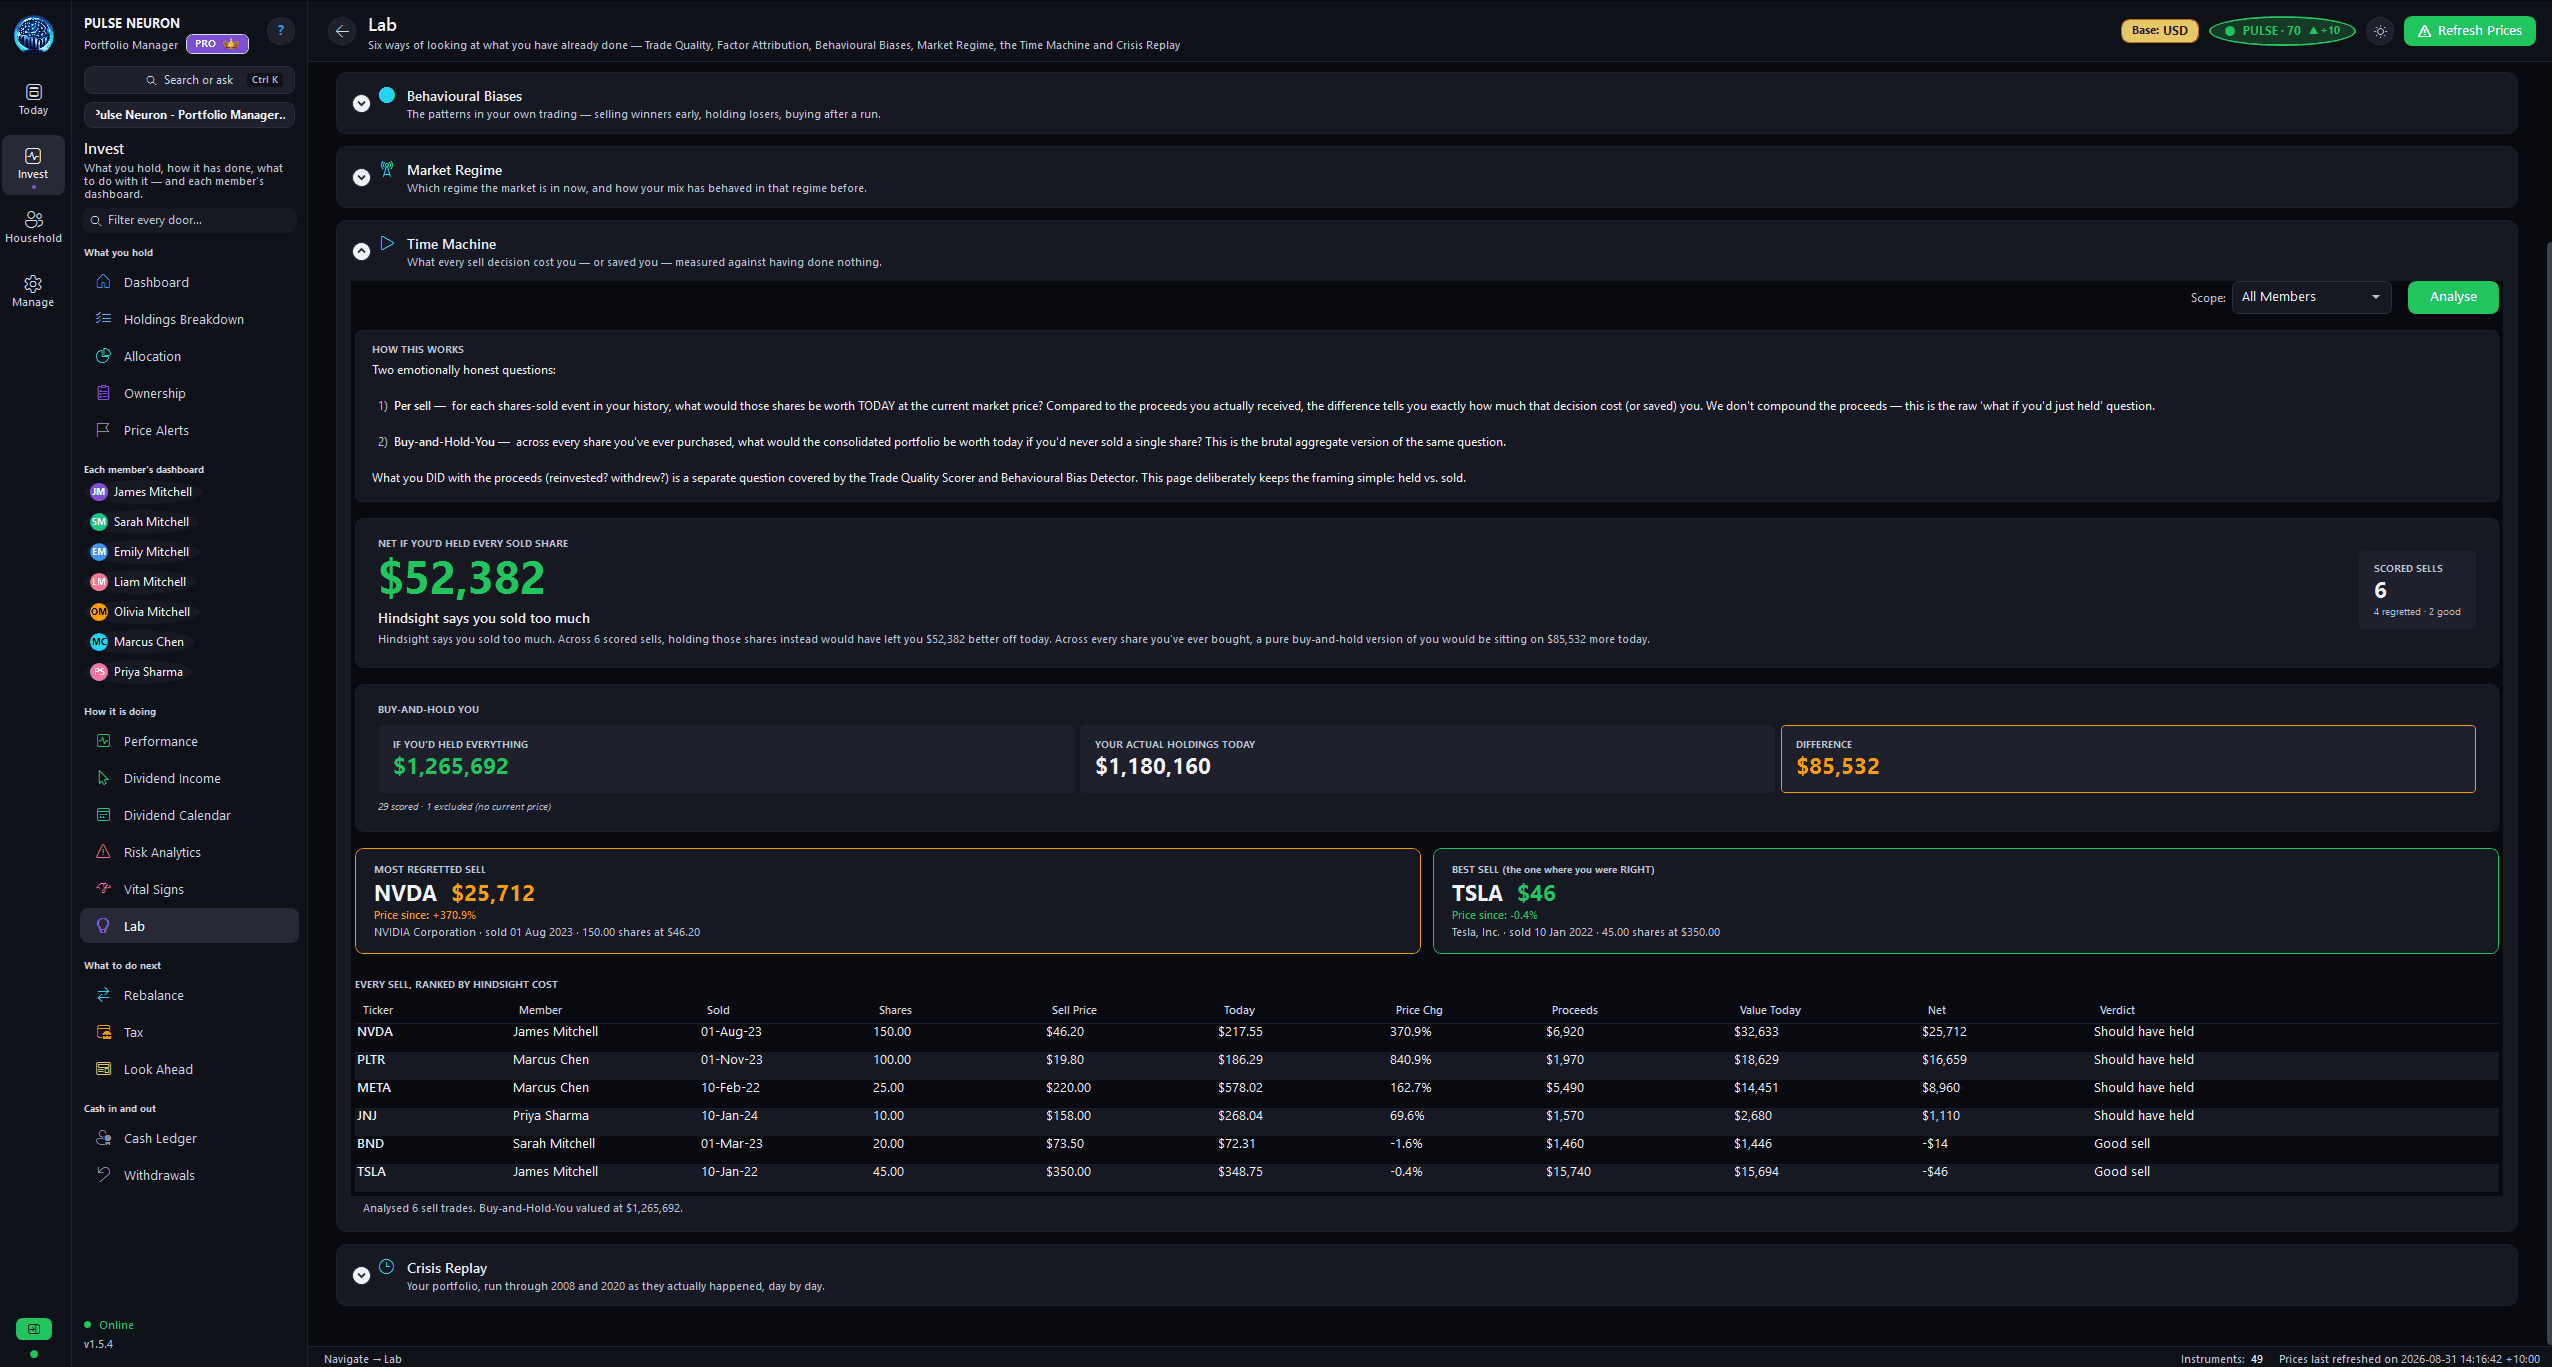
What did selling really cost you?
Replays your sell decisions in hindsight — what every exit actually cost or saved — and models a “Buy-and-Hold You” to compare against your real results.
- Per-trade hindsight P&L on every exit
- A “Buy-and-Hold You” twin to compare against
- Regret / relief scoring
- The cumulative impact of selling
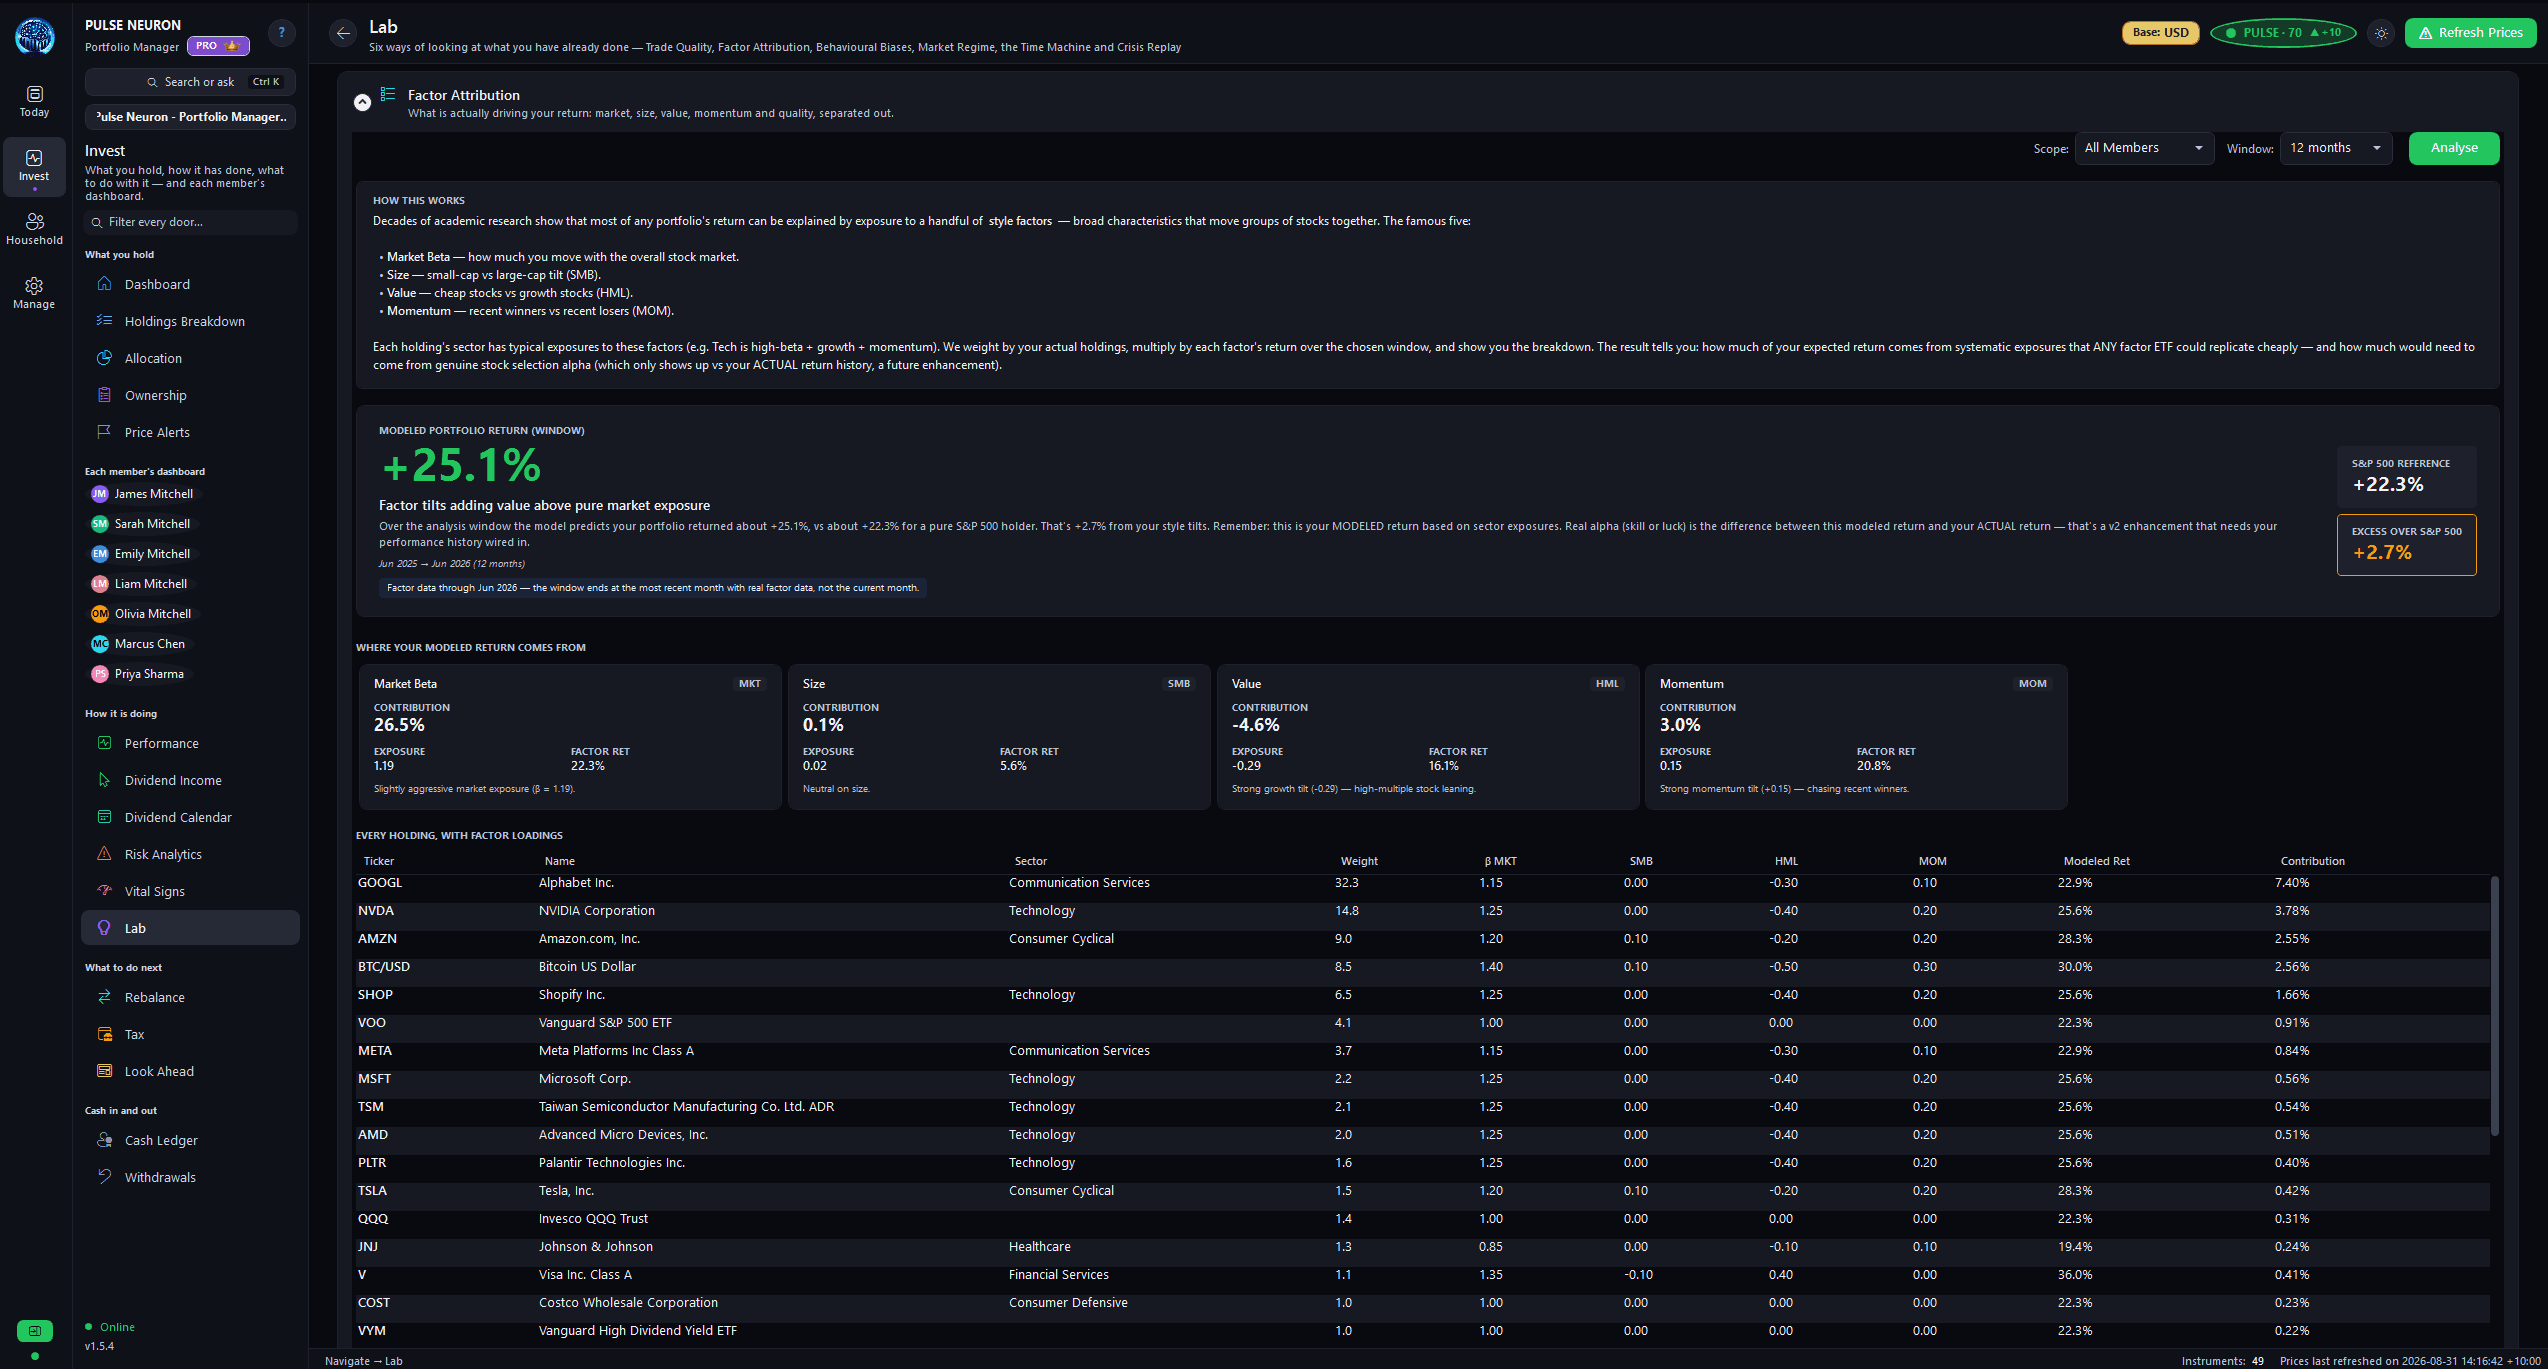
What's really driving your returns
Decomposes your modelled return into market, size, value, momentum, and quality contributions — Fama-French-style factor analysis, made genuinely readable.
- A clear five-factor decomposition
- A contribution waterfall
- Plain-English factor explainers
- Exposure insights you can act on
Return decomposition
Where your modelled return actually came from
+10.5%
total modelled
A Fama-French-style five-factor decomposition, computed locally against your holdings — so you can see whether your returns came from the market, your tilts, or genuine skill.
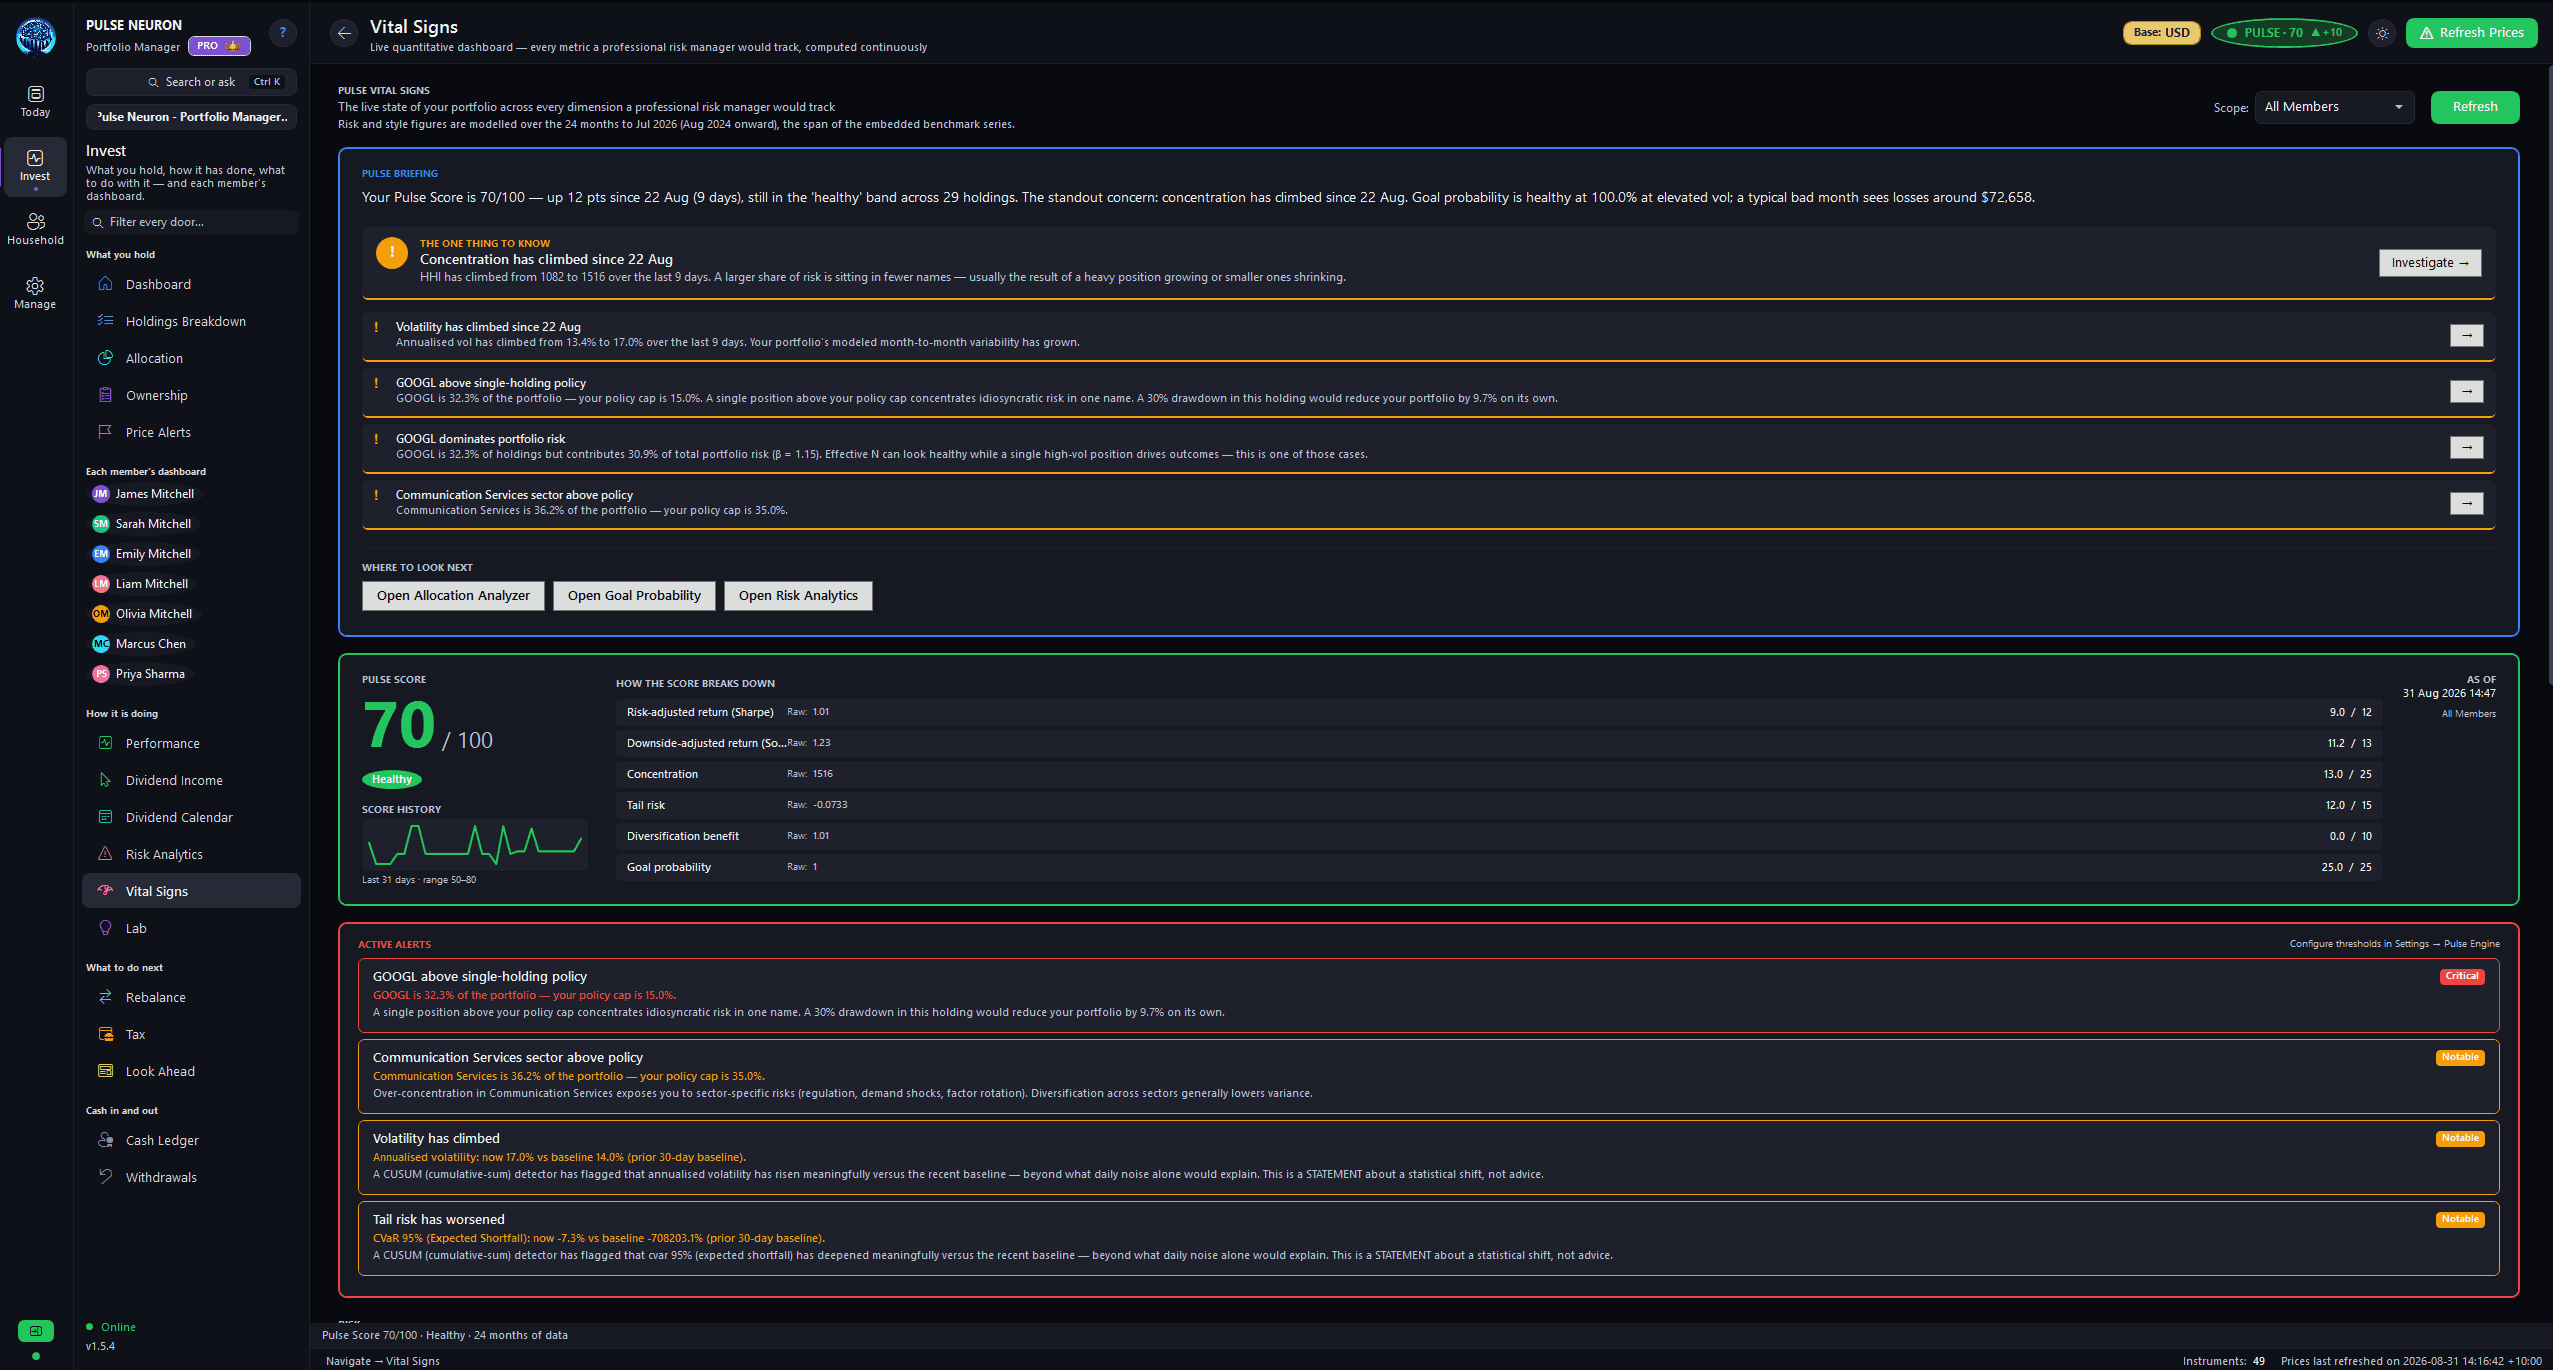
Your portfolio’s vital signs, watched every session
The analyses above are the deep dive. The Pulse Engine is the layer that keeps watch whenever the app is open — recomputing volatility, drawdown, VaR, Sharpe and Sortino, concentration, and beta on the live Vital Signs dashboard, and catching you up on what changed since you last looked. Morning Pulse is its daily plain-English briefing.
- A live Vital Signs dashboard — every metric with a plain-English read
- Personal policy guardrails: max single holding, sector cap, drawdown tolerance, cash buffer
- Quiet, Standard, or Active sensitivity — alerts always capped to prevent fatigue
- A title-bar Pulse Score chip with its 7-day change, visible from any screen
In your title bar
Why it matters
Quant-desk power, zero cloud
Every simulation, decomposition, and replay runs on your own machine. Your trades, your goals, and your numbers never touch a server.
Computed locally
Monte Carlo, factor models, and regime detection run on-device. No account, no upload, no exception.
Explained in plain English
Every number ships with a “what this means” read-out. Institutional methods, human language.
Tied to your real portfolio
Not a textbook demo — these tools analyse your actual holdings, trades, and contributions.
Honest methodology
Every tool discloses its method and assumptions up front. Results are estimates for decision support — never financial advice — and the money math is guarded by 5,100+ automated tests.
Run the numbers the pros run — privately
The Lab is included with Pulse Neuron Pro, alongside the full analytics and planning suites. The entire family-finance side is free, on every plan.